脂质组学检测分析方案
人血清UHPLC-QTOF-MS脂质组学检测分析方案
一、项目简介
1.1 脂质组学介绍
脂质是自然界中存在的一大类极易溶解于有机溶剂、在化学成分及结构上非均一的化合物,主要包括脂肪酸及其天然发生的衍生物(如酯或胺),以及与其生物合成和功能相关的化合物。
脂质大体分为八大类:1.脂肪酸类(fatty acids)2.甘油脂类(glycerolipids)3.甘油磷脂类(glycerophospholipids)4.鞘脂类(sphingolipids)5.固醇脂类(sterol lipids)6.孕烯醇酮脂类(prenol lipids)7.糖脂类(saccharolipids)8.多聚乙烯类(polyketides)。
脂质组学(lipidomics)是对生物体、组织或细胞中的脂质以及与其相互作用的分子进行全面系统的分析、鉴定,了解脂质的结构和功能,进而揭示脂质代谢与细胞、器官乃至机体的生理、病理过程之间的关系的一门学科。目前脂质组学已经被广泛运用于药物研发,分子生理学,分子病理学,功能基因组学,营养学以及环境与健康等重要领域。
脂质组学研究的技术主要包括脂质的提取、分离、分析鉴定以及相应的生物信息学技术。生物质谱技术是目前脂质组学研究的核心工具。脂质组学相关的公共资源:LIPIDMAPS、Lipid Bank、Cyber Lipids和LIPIDAT。
1.2 样本信息
人血清样品,分对照组(C)、模型组I(M1)和模型组II(M2),每组取25个平行样品,进行UHPLC-QTOF-MS脂质组学检测分析,并对得到数据进行进一步生物信息学分析。
样品详情:共计75例样品。
1.3 对比策略
针对脂质组学数据分别进行如下对比,并对得到数据进行进一步的生物信息学分析:
进行M1组 vs C组,M2组 vs C组,M2组 vs M1组共计3次对比分析。
1.4分析内容
基础数据分析包括:数据预处理,定性及定量分析,PCA 分析(principal component analysis),正交偏最小二乘法判别分析(OPLS-DA),差异脂质化合物筛选。
个性化数据分析包括:脂质气泡图
1.5 检测平台
检测平台:UHPLC-QTOF-MS, AB Triple TOF 6600, AB Sciex
二、数据分析方案
基础数据分析
2.1 数据预处理
样本在高分辨质谱上分别做了正负离子两次扫描,基于IDA功能进行一级、二级质谱数据采集。在每个数据采集循环中,筛选出强度最强且大于100的分子离子进行对应的二级质谱数据采集,得到原始数据文件。通过质控样品的原始总离子流(TIC)色谱图,初步观察仪器的保留时间重现性,所测得的峰数量,以及初步判断脂质大类检测情况。数据的质控采用QC样本RSD<30%进行筛选,features得率>80%,则说明系统稳定性良好。峰查询,峰对齐等预处理采用XCMS软件(版本号:1.41.0)进行。
图1. 所有质控样本正离子(ESI+)模式重叠总离子流(TIC)色谱图
图2. 所有质控样本负离子(ESI-)模式重叠总离子流(TIC)色谱图
2.2 定性及定量分析
物质鉴定的数据处理及匹配:使用本实验室基于XCMS开发的xcms4dda和xcms4lipid程序及自建库进行处理。首先对二级数据进行筛选,也就是筛选出来那些鉴定出来的peak。筛选原则为forward和reverse只要其中有一个鉴定出来就保留该peak。其次对一级和二级数据的peak进行匹配,也就是寻找一级数据中的peak在二级数据中对应的peak。
最终的鉴定结果如下表所示:
图3. 样本的定性定量结果(部分)
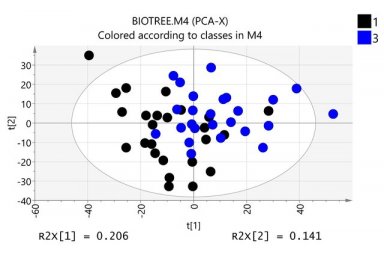
2.3 PCA分析(principal component analysis)
数据经过标准化处理后,对样本进行主成分分析,该分析能从总体上反应各组样本之间的总体代谢差异和组内样本之间的变异度大小。软件采用瑞典Umetrics公司的SIMCA14.1,数据采用UV格式化(Unit Variance Scaling)和平均中心化(Mean-Centered)处理[1],以获得更加可靠且更加直观的结果。软件进行自动化模型拟合分析,获得最可靠数学模型的主成分数目。例图如下所示:
图4. Scores plot of total PCA
图5. Scores plot of PCA for two groups
| Base weight type | Description |
| UV | Variable j is centered and scaled to "Unit Variance", i.e. the base weight is computed as 1/sdj, where sdj is the standard deviation of variable j computed around the mean . |
| Par | Variable j is centered and scaled to Pareto Variance, i.e. the base weight is computed as 1/sqrt(sdj), where sdj is the standard deviation of variable j computed around the mean. Pareto scaling is in between no scaling and UV scaling and gives the variable a variance equal to its standard deviation instead of unit variance. |
| Ctr | The variable is centered but not scaled (ws = 1) |
2.4正交偏最小二乘法判别分析(OPLS-DA)
为了消除与分类不相关的噪音信息,同时也为了获得导致两组之间显著差异的相关代谢物信息,我们采用正交偏最小二乘方判别分析(OPLS-DA)过滤与模型分类不相关信号即正交信号,获得OPLS-DA模型。对模型的质量用交叉验证法进行检验,并用交叉验证后得到的R2X 和Q2(分别代表模型可解释的变量和模型的可预测度)对模型有效性进行评判。在此之后,通过排列实验对模型有效性做进一步的检验。
例图如下所示:

图6. Scores plot of OPLS-DA(2D) 图7. Loading plot of OPLS-DA[2]
[2] 载荷图(loading plot)的横坐标代表每个物质在第一主成分上的载荷大小(cosα),纵坐标代表每个物质在第二主成分上的载荷大小(cosβ)。

图8. Permutation test of OPLS-DA[3] 图9. S-plot of OPLS-DA [4]
[3] 置换检验的横坐标代表随机分组的Y与原始分组Y的相关性,纵坐标代表R2和Q2的得分。
[4] S-plot的横坐标代表每个物质在第一主成分上的载荷大小(cosα),纵坐标代表每个物质和第一主成分相关系数(可靠性)的大小。
2.5差异脂质化合物筛选
通过OPLS-DA分析过滤掉了不相关的正交信号,因而获得的差异性代谢物更加可靠。本项目采用 OPLS-DA 模型第一主成分的VIP(Variable Importance in the Projection)值(阈值>1),并结合学生氏t 检验(t-test)的p 值(阈值0.05)来寻找差异性表达代谢物。
| ID | MZmed | RTmed | Mean 1 | MEAN 3 | P-Value | Q-Value | Fold Change | Log_Fold Change | VIP | Lipids Name |
| 8 | 765 | 469.0365 | 0******/span> | 0******/span> | 7.37553E-05 | 0******/span> | 0.731948948 | -0.450185069 | 1.53399 | - |
| 12 | 767 | 469.2015 | 0******/span> | 0******/span> | 0******/span> | 0.00048108 | 0.74139806 | -0.431679755 | 1.51101 | PC(P-18:0/18:4) |
| 15 | 779 | 469.2845 | 0******/span> | 0******/span> | 6.49628E-07 | 9.28099E-06 | 0.657181263 | -0.605636747 | 1.87604 | - |
| 17 | 562 | 243.8225 | 6.73951E-06 | 1.25317E-05 | 4.32477E-10 | 3.21988E-08 | 0.537797624 | -0.894864714 | 2.17006 | PC(O-22:2/0:0) |
| 19 | 574 | 243.715 | 3.36057E-05 | 6.71085E-05 | 2.25045E-11 | 4.06517E-09 | 0.500766088 | -0.997791228 | 2.35109 | - |
| … | … | … | … | … | … | … | … | … | … | … |
表1.差异脂质化合物列表(部分)
我们将筛选差异代谢物的结果以火山图(volcano plot)的形式进行可视化,结果如图所示:
图10. 差异脂质代谢物筛选火山图
个性化数据分析
使用各组脂质含量的相对百分比差异构建气泡图,不同的脂类用不同的颜色表示,每个气泡代表一种脂,点的大小代表差异的显著性。
图11. 差异脂质气泡图
*费用概算可详情咨询技术人员
脂质组学检测分析方案,AB Sciex Triple TOF 6600
脂质组学检测分析方案信息由上海百趣生物医学科技有限公司为您提供,如您想了解更多关于脂质组学检测分析方案报价、型号、参数等信息,欢迎来电或留言咨询。